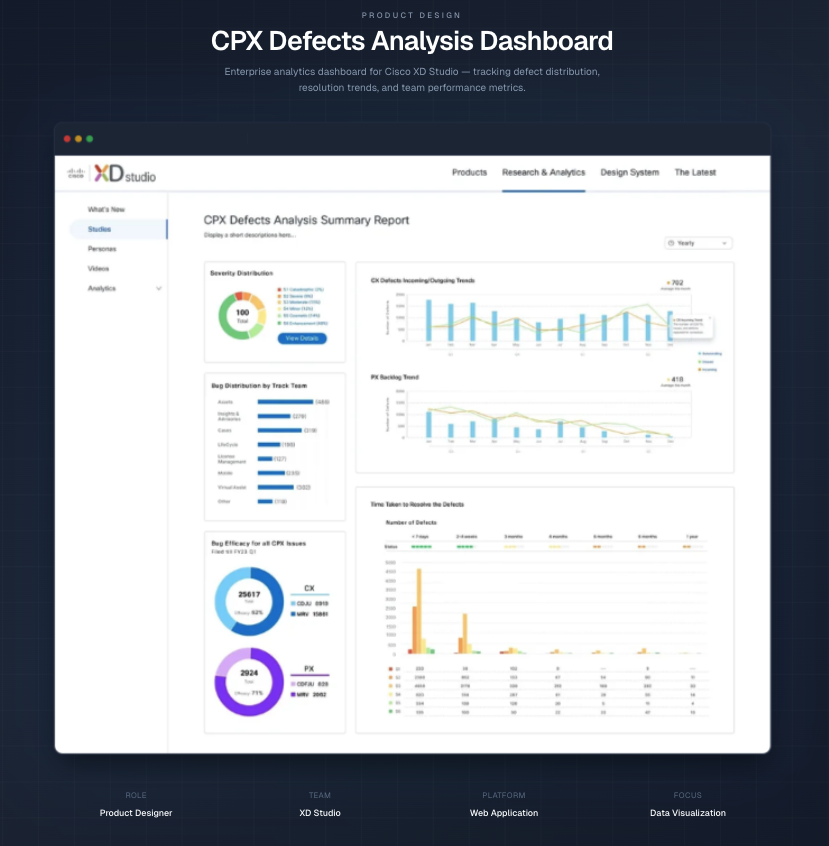
Defect Intelligence Dashboard
Transforming Cisco CX static reporting into real-time, actionable insights for faster engineering decisions

Summary
I led the UX transformation of Cisco’s CX defect reporting workflow for internal leadership and engineering teams, replacing manual PowerPoint reporting with an interactive dashboard that enables real-time insights, faster exploration, and data-driven decision making.
Role
Lead Product Designer
Scope
• UX Strategy
• Data Visualization
• Dashboard Design
Collaboration
• Engineering Team
• Top Management
Outcome
• Faster defect insights
• Less reporting effort
• AI-ready monitoring
The Problem
Static reporting slowed decision making
Defect reporting relied on manually assembled PowerPoint decks, requiring significant effort to gather, format, and present data. While the reports contained valuable insights, the format prevented teams from exploring trends or identifying risks quickly.
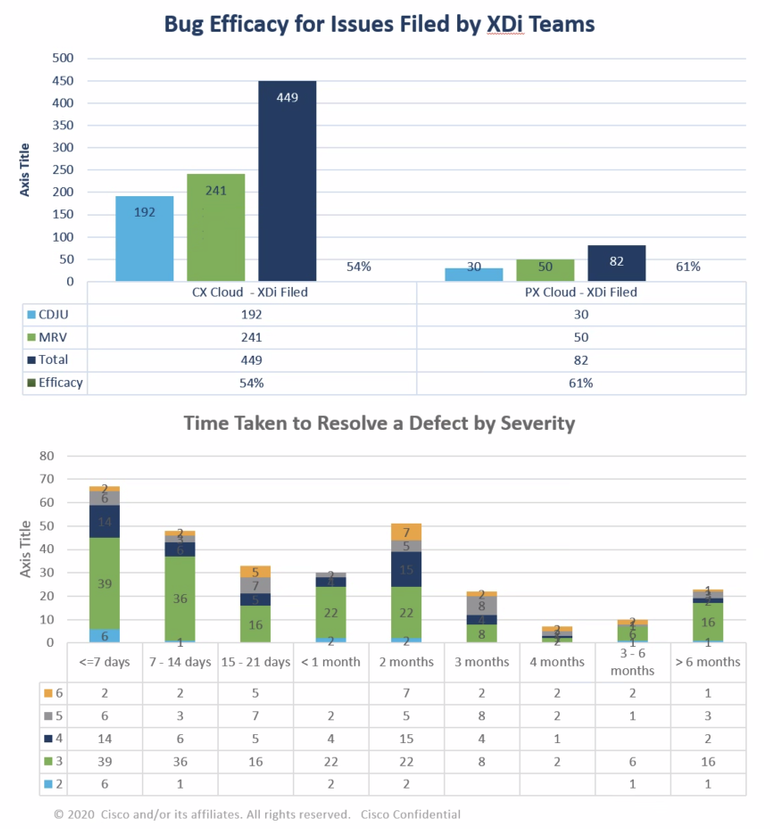
The original chart:
Manual, PowerPoint-Based Reporting
Key Challenges
Manual Reporting
Teams spent hours collecting and formatting defect data for executive presentations.
Limited Exploration
Stakeholders could not drill into trends, ownership, or severity patterns.
Delayed Insight
Critical issues often surfaced too late due to lack of real-time visibility.
Delayed Insights
No smart analysis to enable proactive decisions
Problems to Solve
95%
Time Intensive
Hours spent gathering and formatting data
90%
Manual PowerPoint
Repetitive static slides
lacked automation
85%
No Interactivity
Users couldn’t explore trends dynamically
85%
Why This Mattered
The reporting workflow focused more on creating slides than understanding the data.
Product leaders needed faster ways to identify risk, track trends, and make informed
decisions about product quality.
This presented an opportunity to transform reporting into a data intelligence platform.
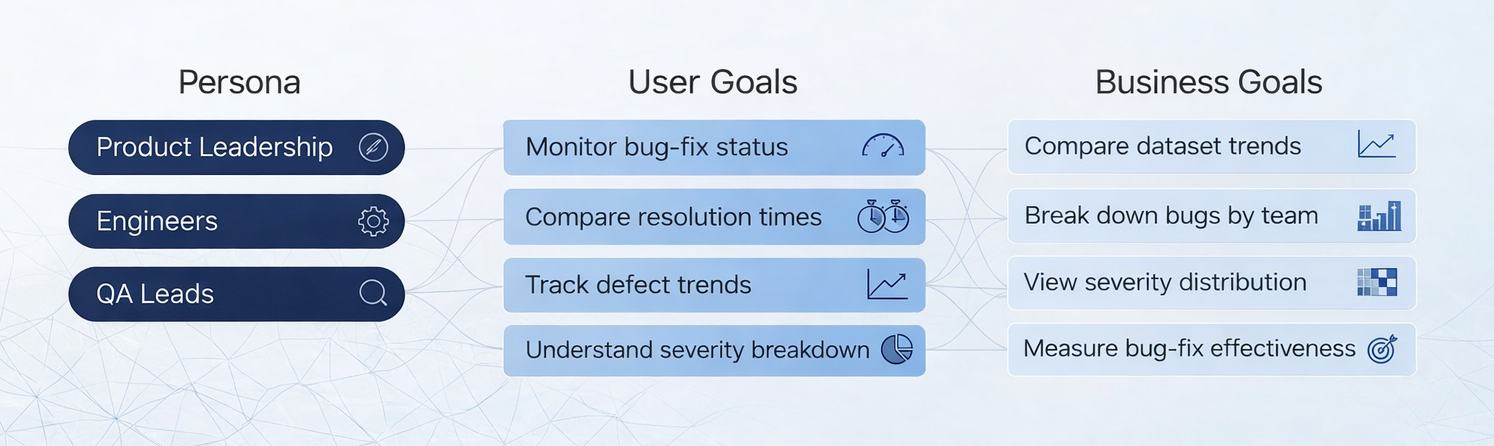
Users & Goals
User Journey
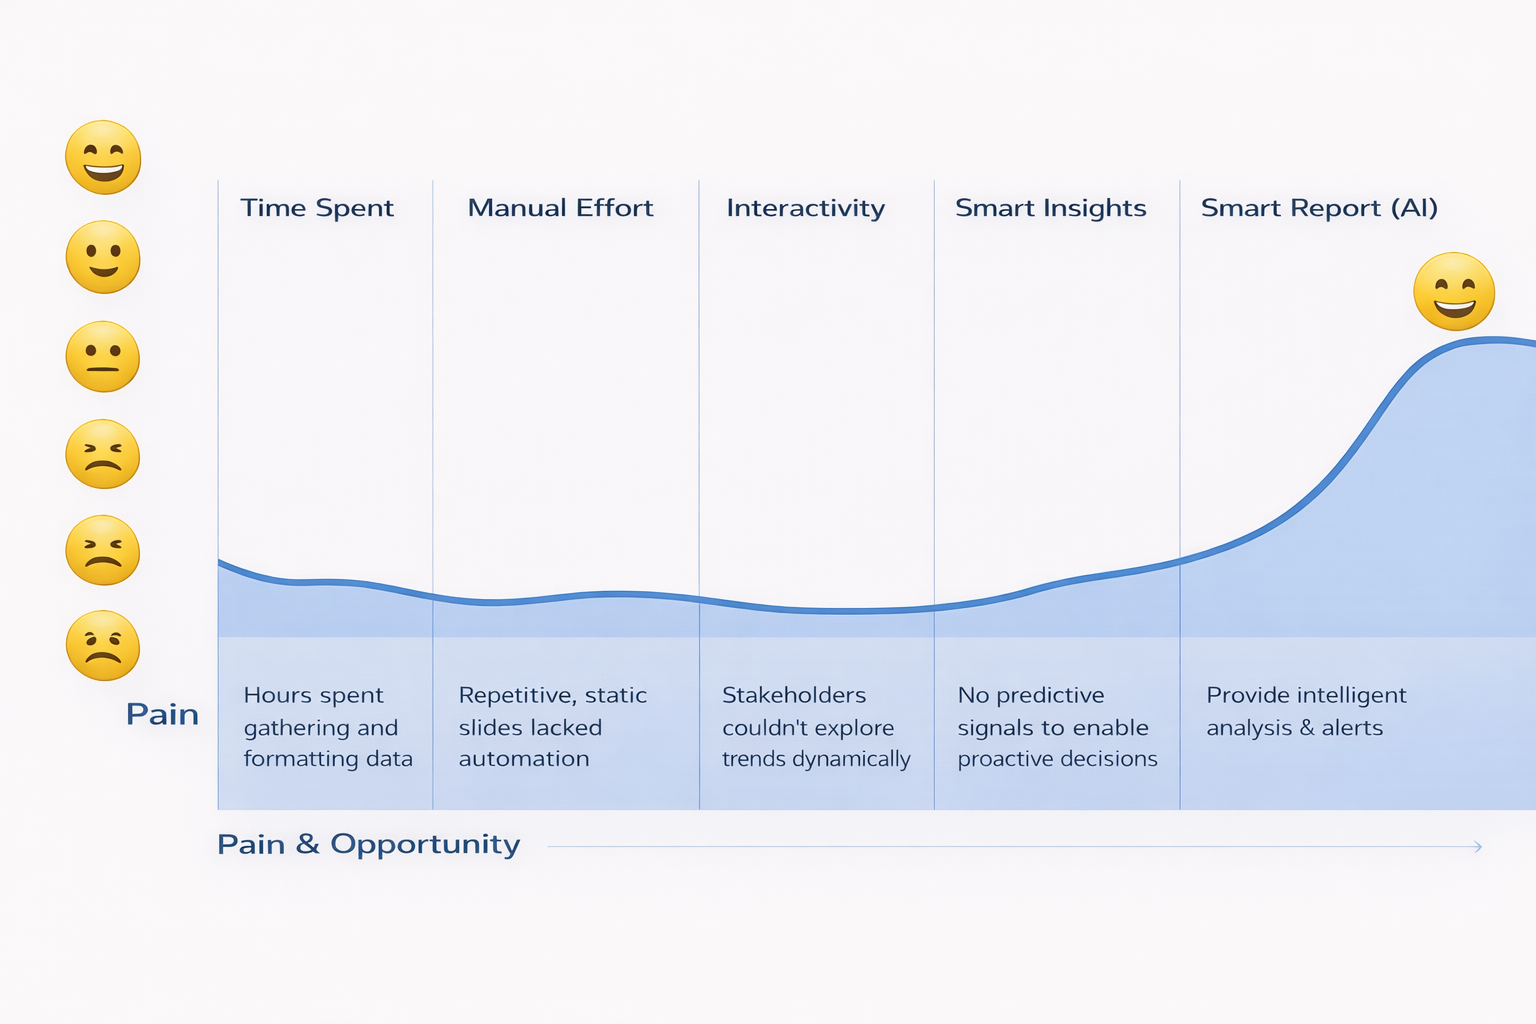
This journey reframes the limitations of static, PowerPoint-based reporting: manual effort, ambiguity, and slow decision cycles into opportunities for intelligence and empowerment. Through AI-enabled insights and streamlined interactions, the dashboard evolves from reactive data consumption into proactive, confident decision-making.
Timeline
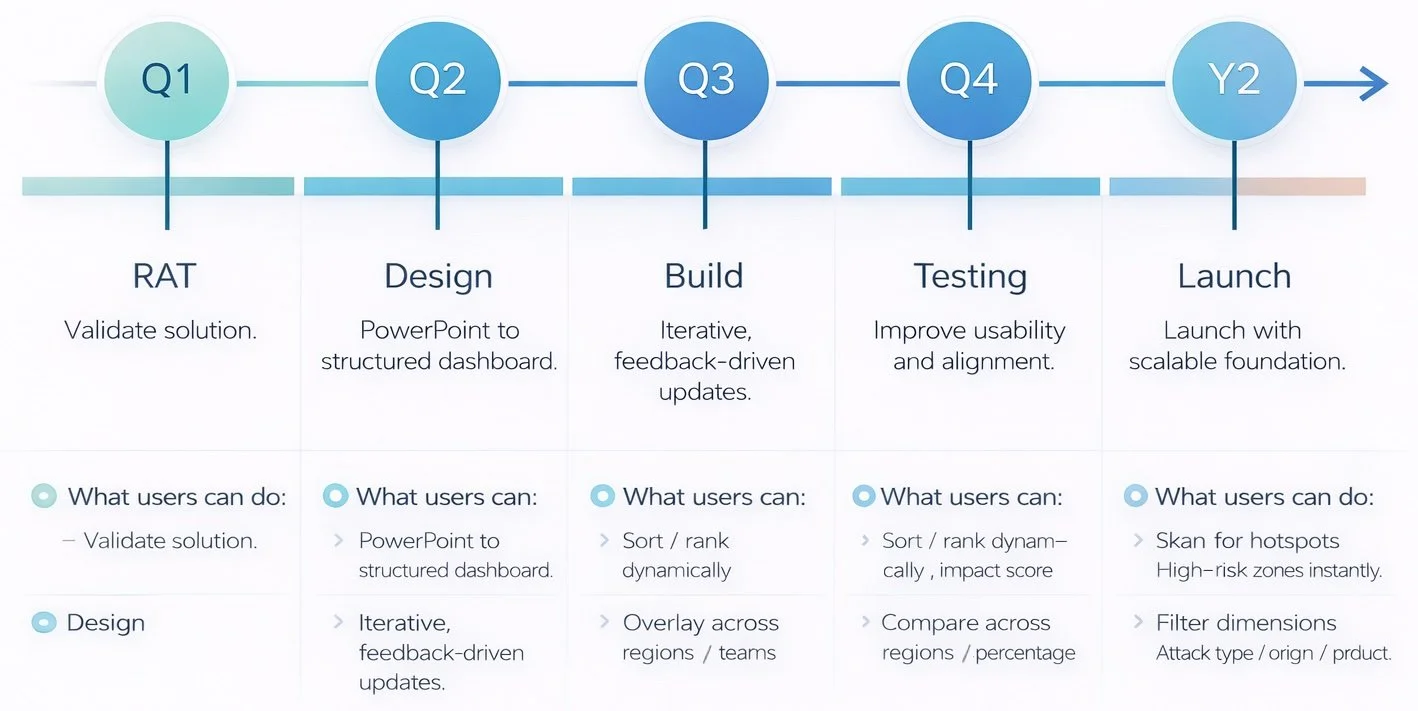
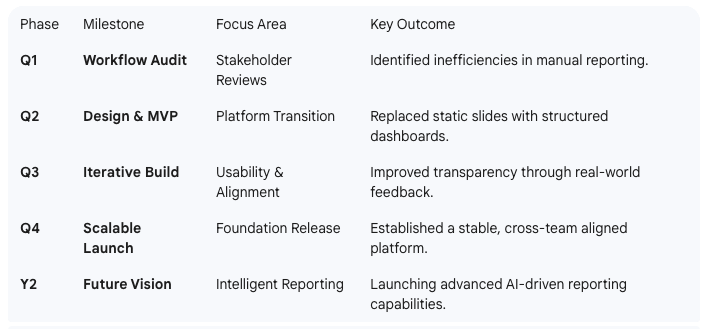
A hybrid agile approach guided the transition from static PowerPoint reporting to an interactive online platform. Early workflow audits and stakeholder reviews identified key inefficiencies, allowing us to prioritize high-impact improvements and launch an MVP focused on replacing manual, slide-based processes with structured dashboards.
Through iterative releases and real-world feedback, the platform evolved to improve usability, transparency, and cross-team alignment, establishing a scalable foundation for future intelligent reporting capabilities.
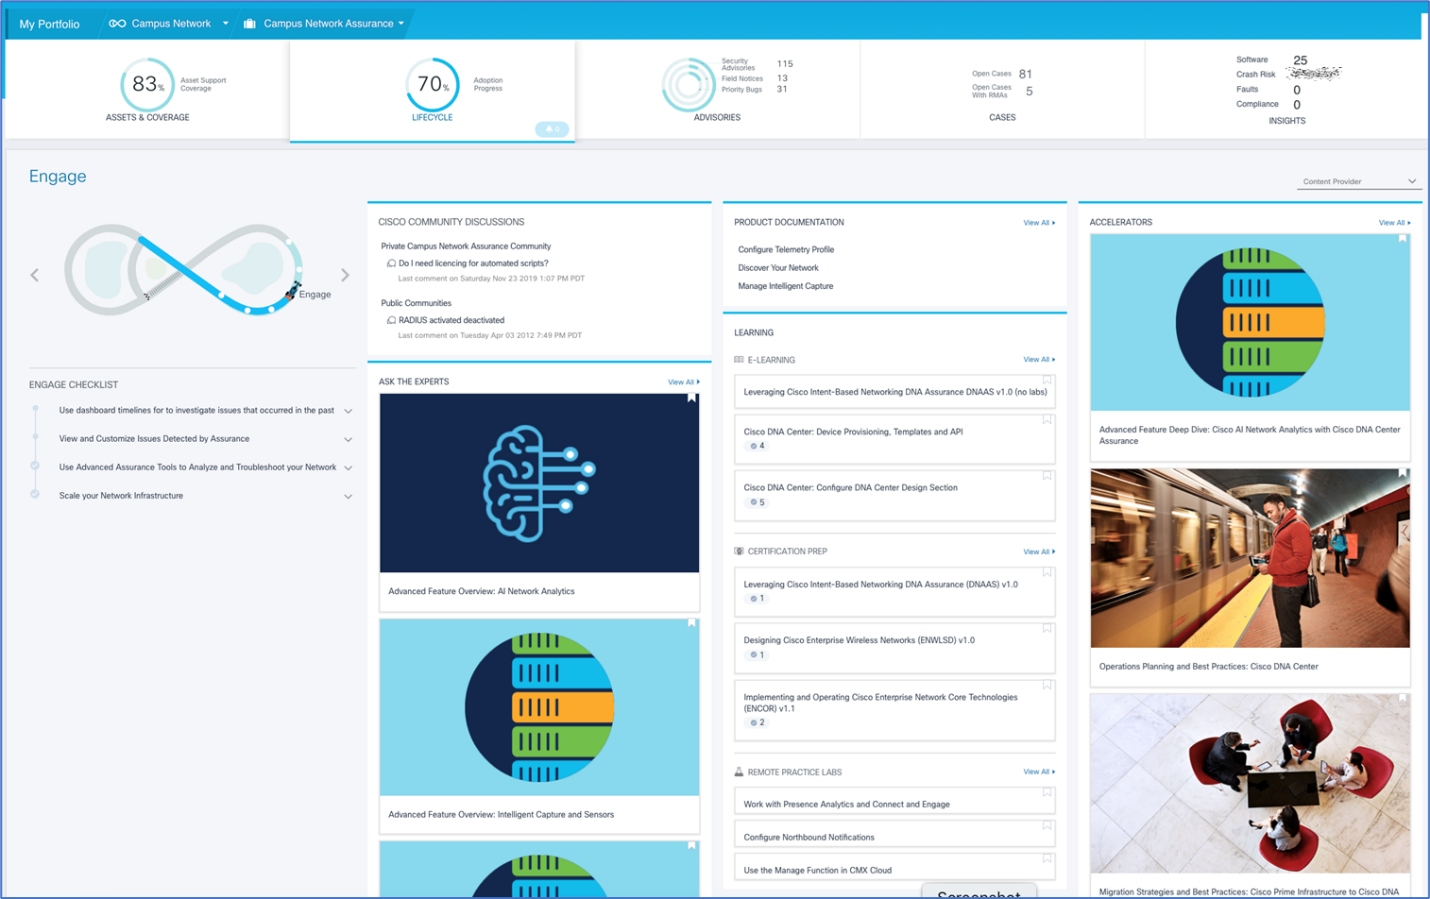
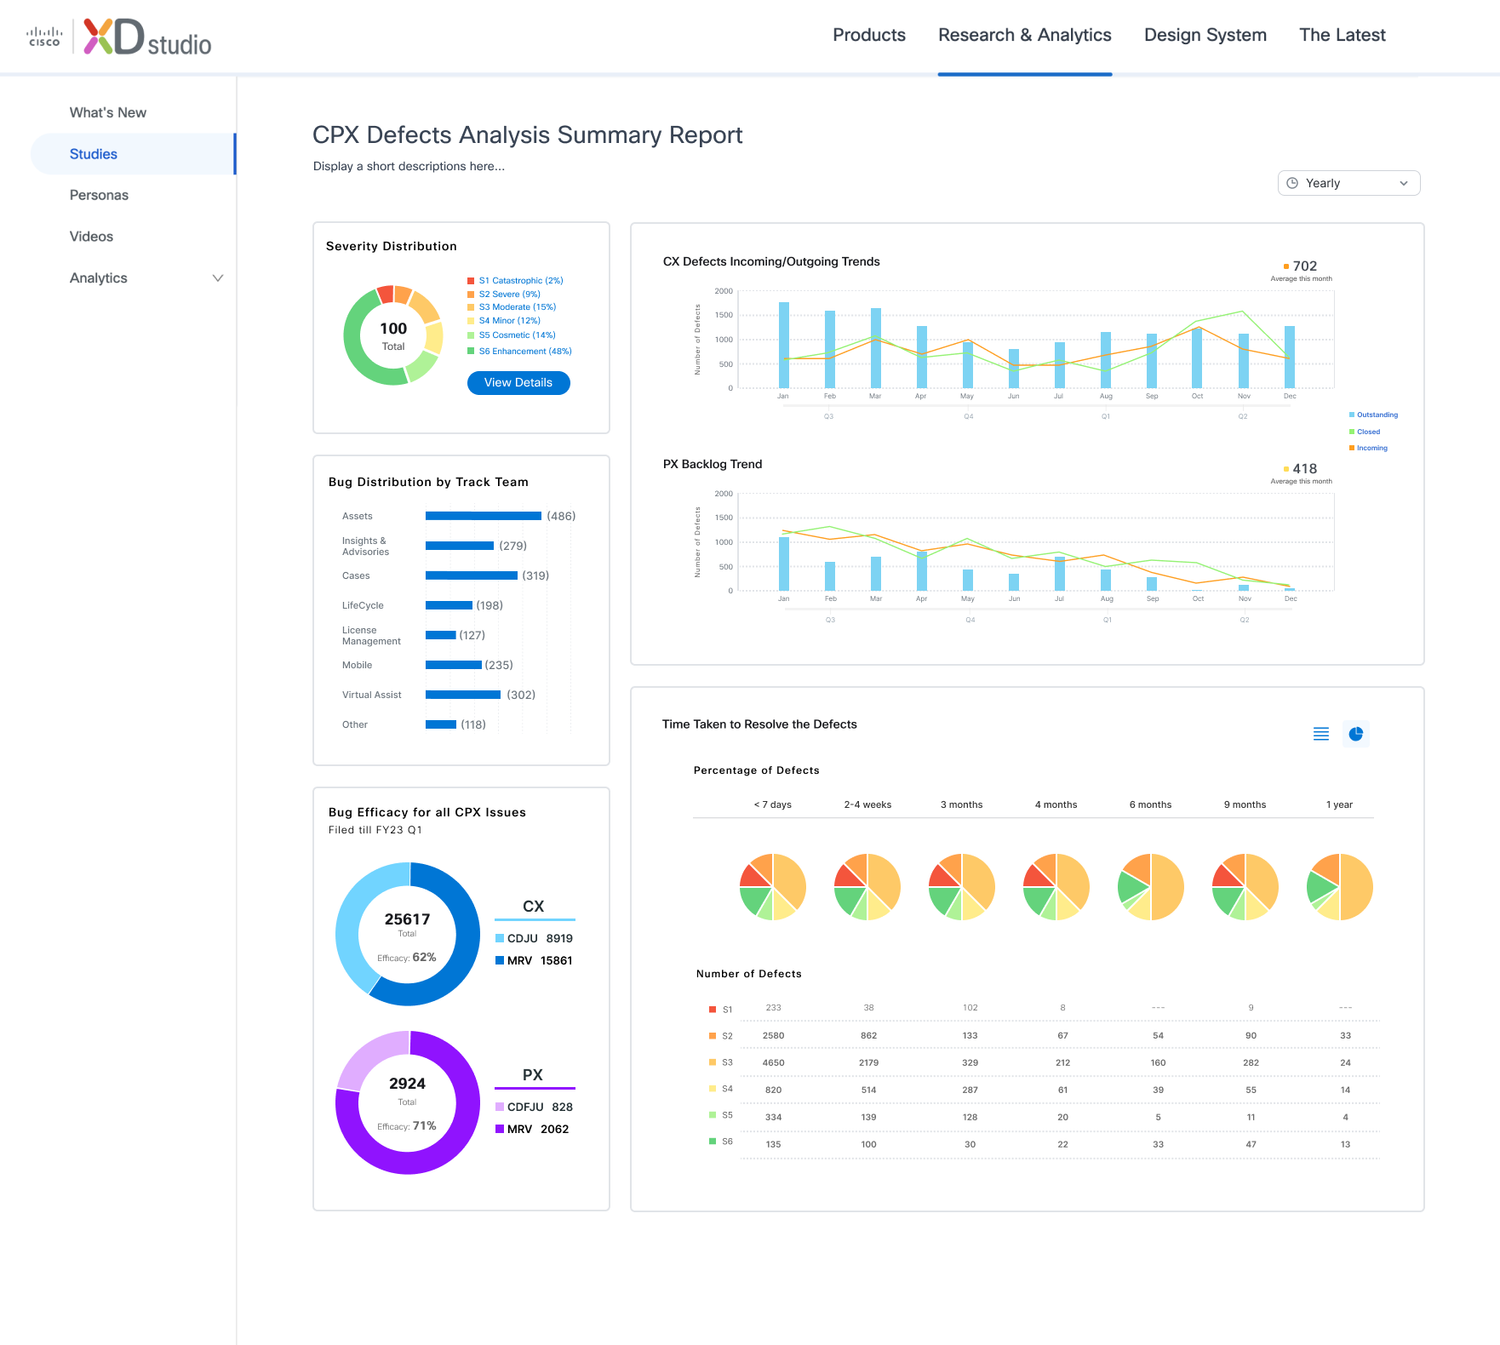
Before:
Static, Manual Reporting That Restricted Insight
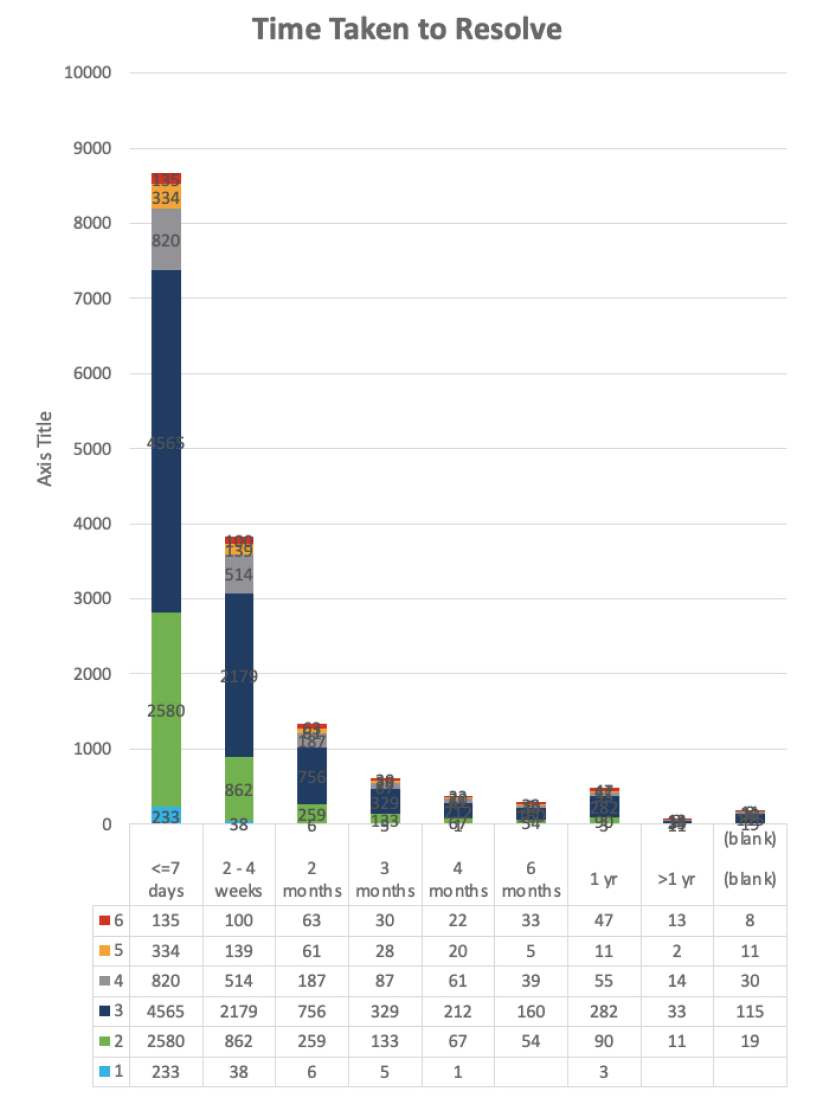
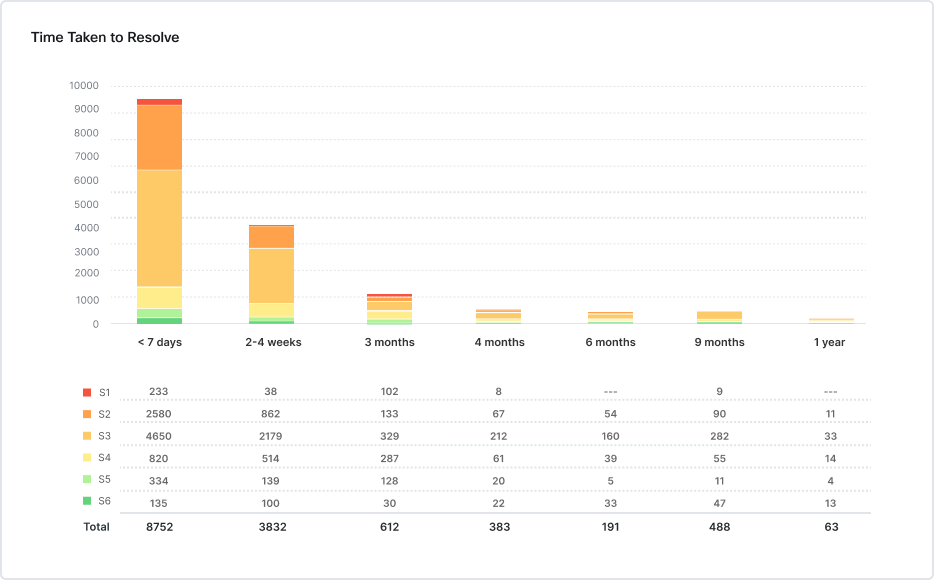
The original chart:
• Manual data preparation
• Dense charts difficult to interpret
• No interactive exploration
• Limited visibility into patterns
Improved Design 1
• Dynamic data exploration
• Clear visualization hierarchy
• Faster insight into severity trends
• Predictive monitoring
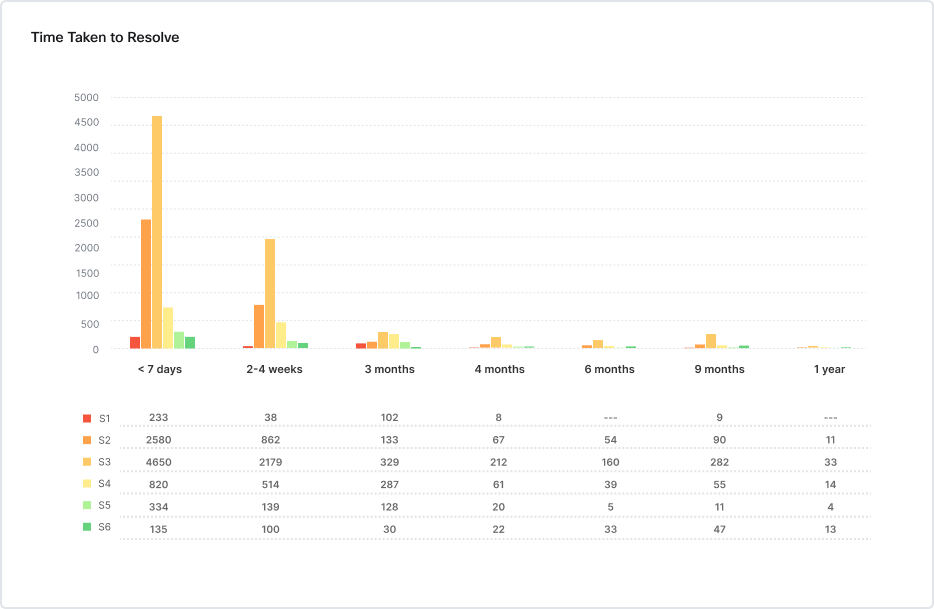
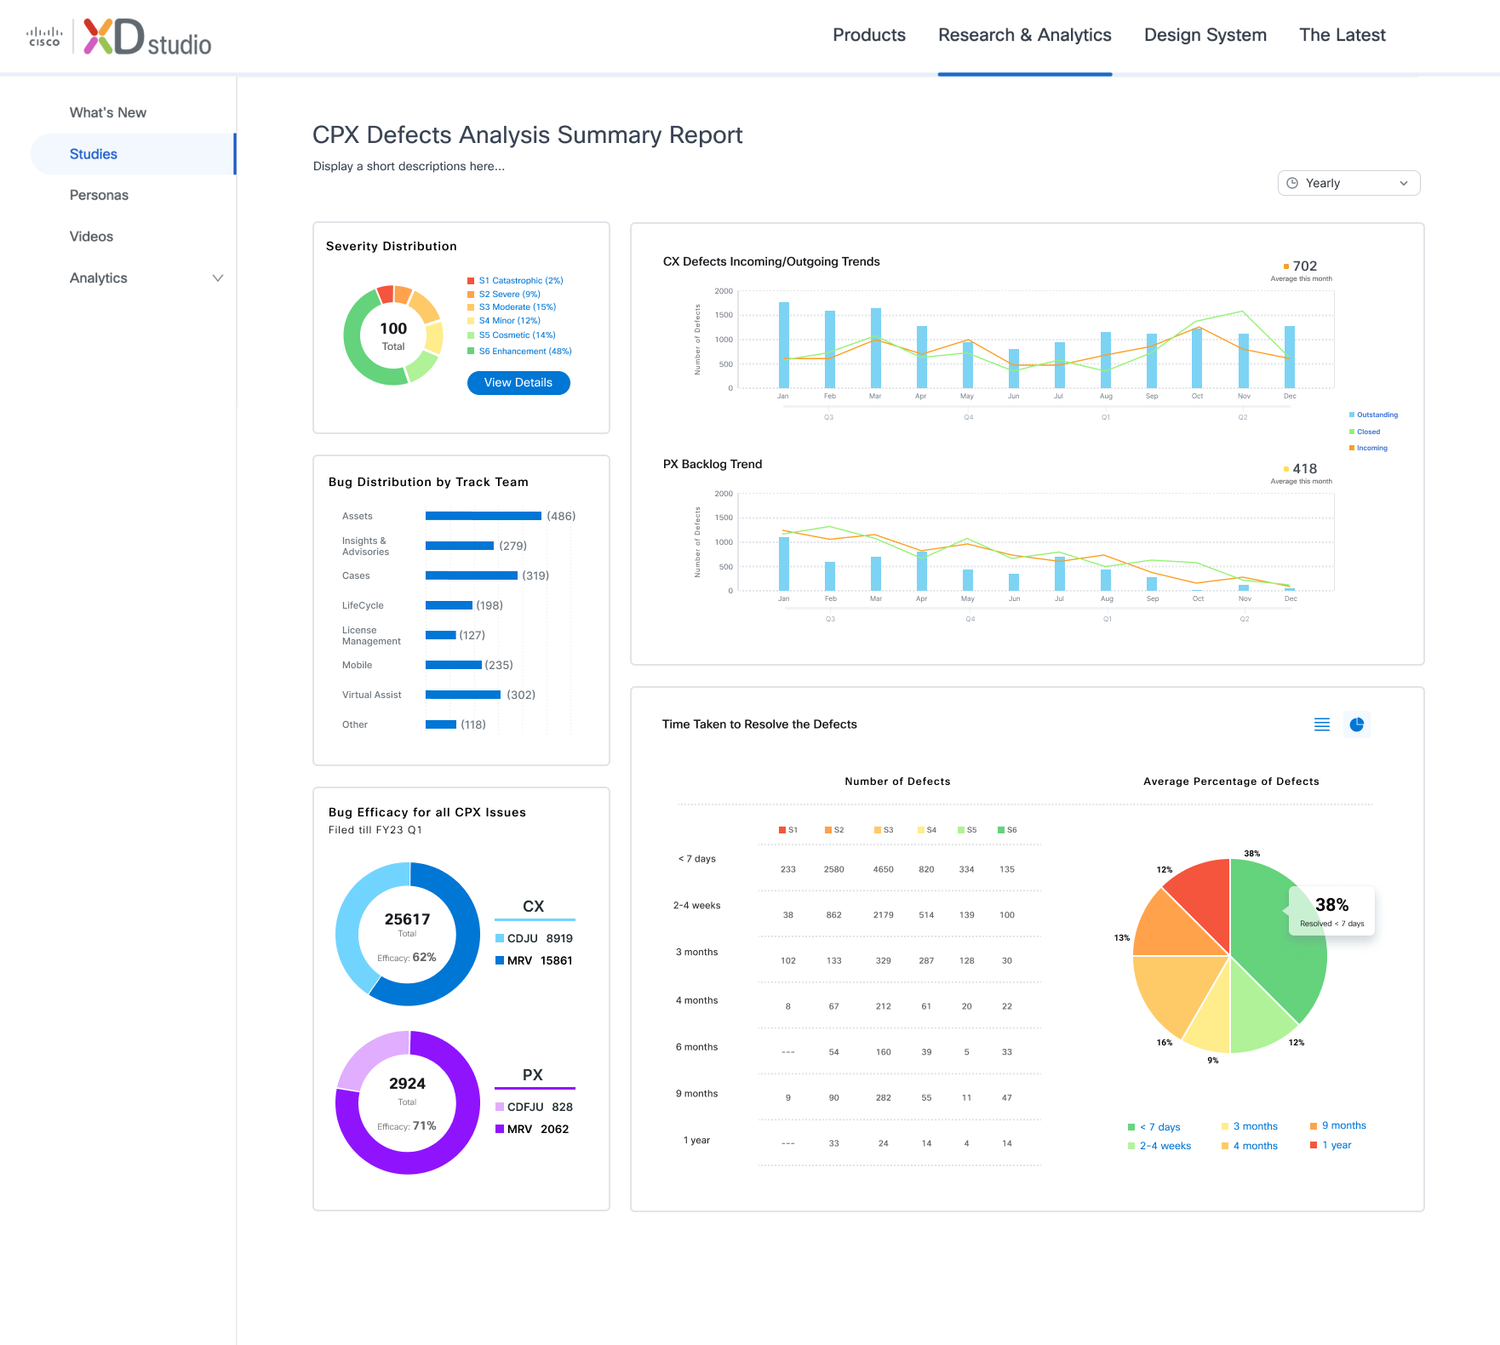
Improved Design 3
Severity levels displayed side-by-side for easier comparison.
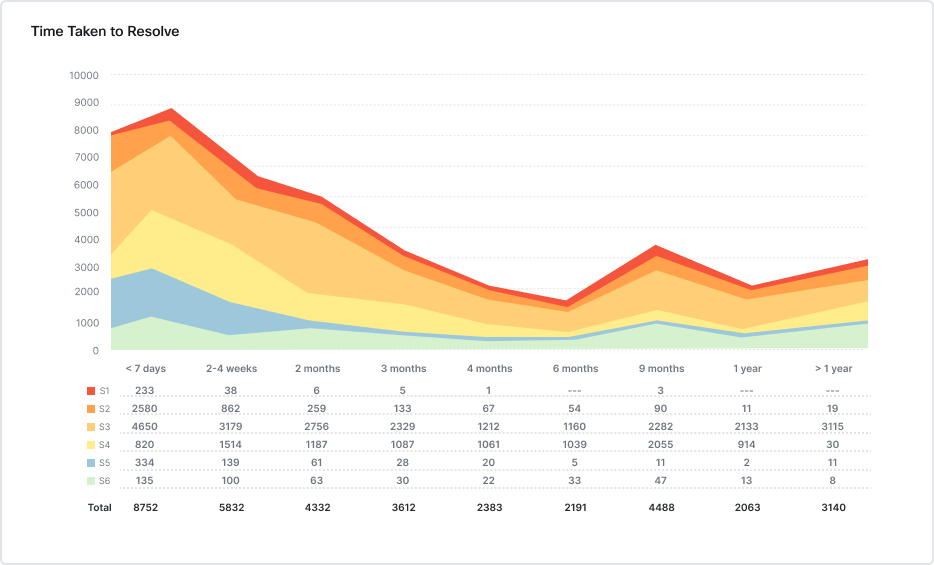
Improved Design 2
Area chart enables clear trend visualization across time periods.
Before → After Transformation
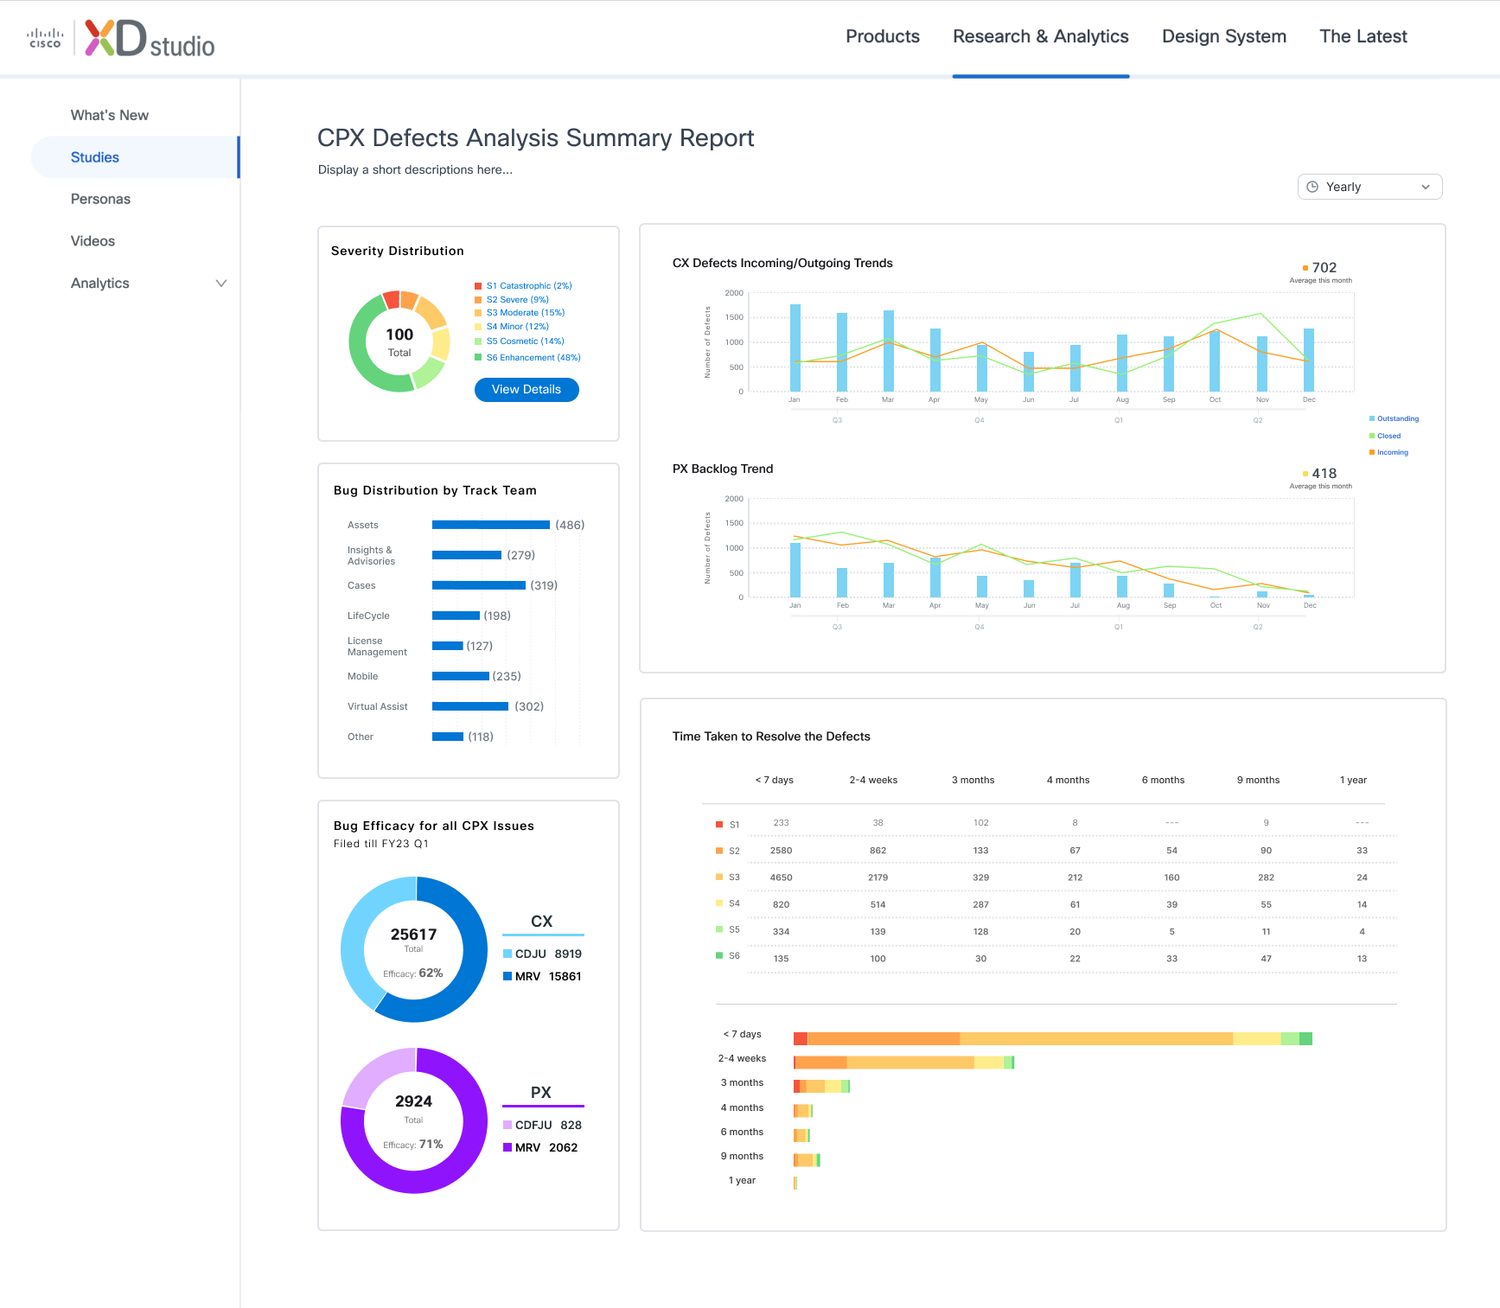
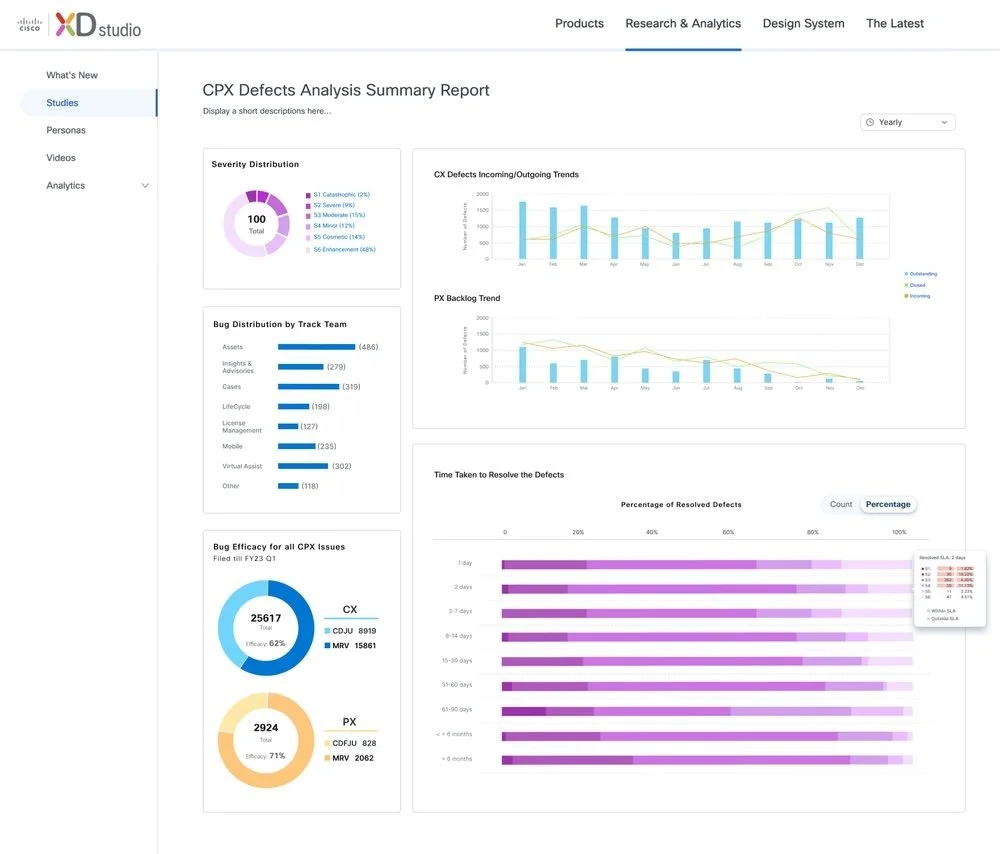
After:
Interactive defect intelligence dashboard
Iteration
The visualizations below explore refined approaches to presenting bug data, helping teams quickly identify patterns, priorities, and system health.
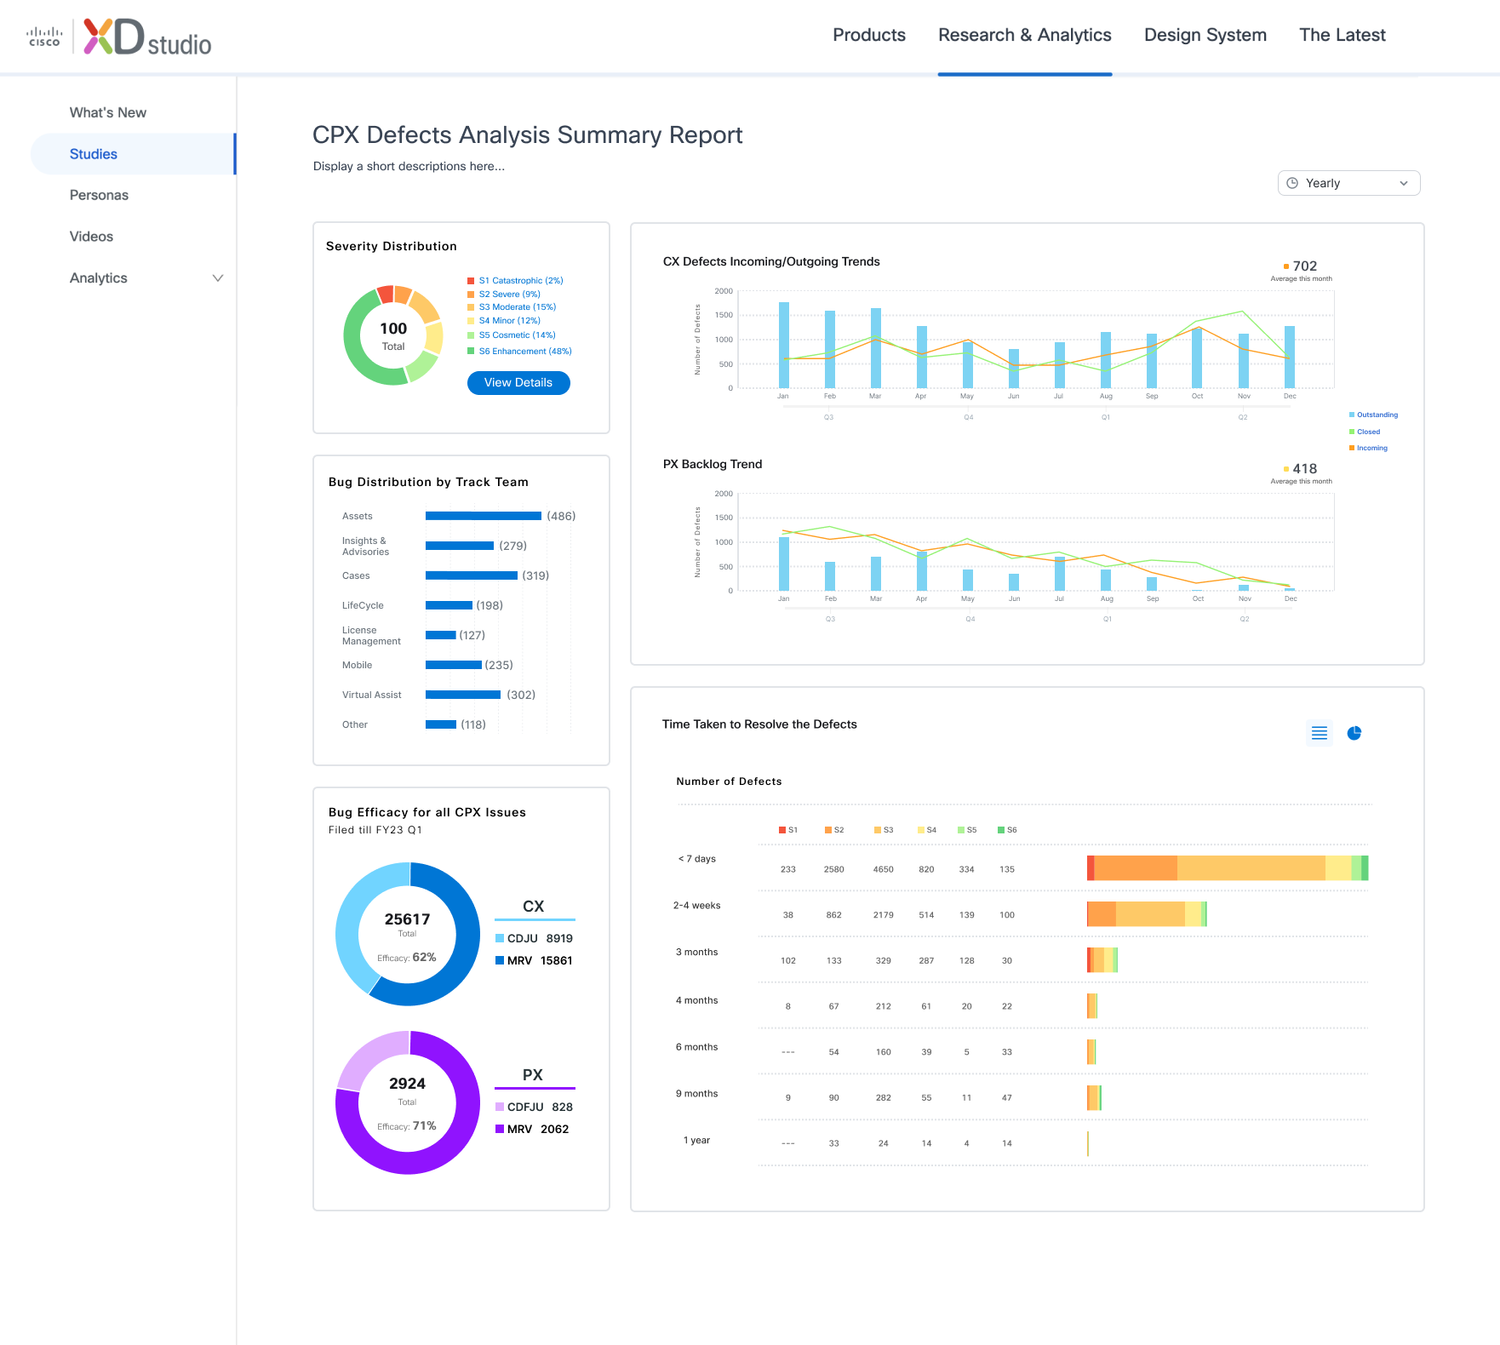
• Clear hierarchy between severity levels
• Improved readability of small values
• Better comparison across time periods
• Simplified color and visual structure
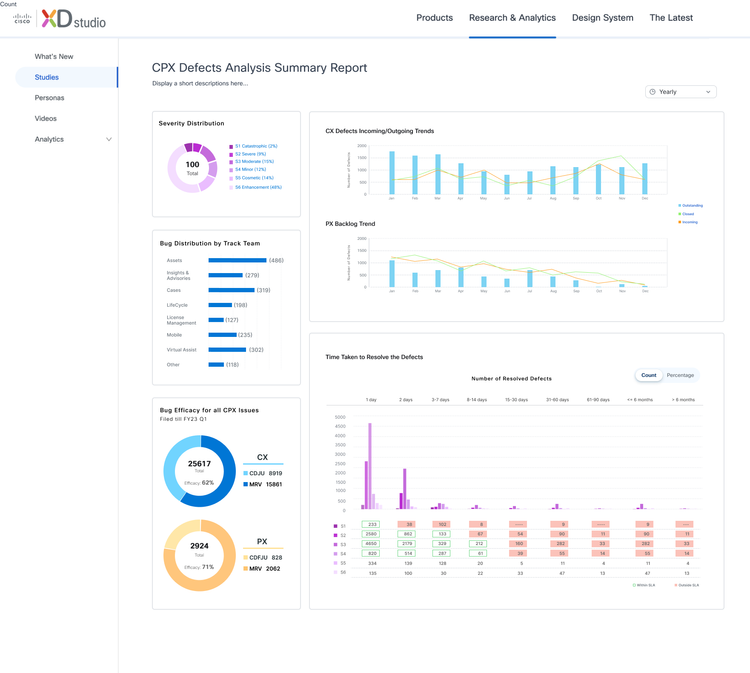
Final Data Visualization Design
These improvements enabled stakeholders to quickly understand defect distribution and trends.
How I Designed the
AI Experience
Trust & Action AI Framework
My focus was not just adding AI features, but shaping how intelligence should appear in the experience so it feels useful, trustworthy, and easy to act on.
This project focuses on a different AI problem than search. Instead of helping users find information, the goal is to support decision-making under uncertainty.
I designed the AI experience to reduce cognitive load, surface clear reasoning, and connect insights directly to action, so teams can move from analysis to decisions with confidence.
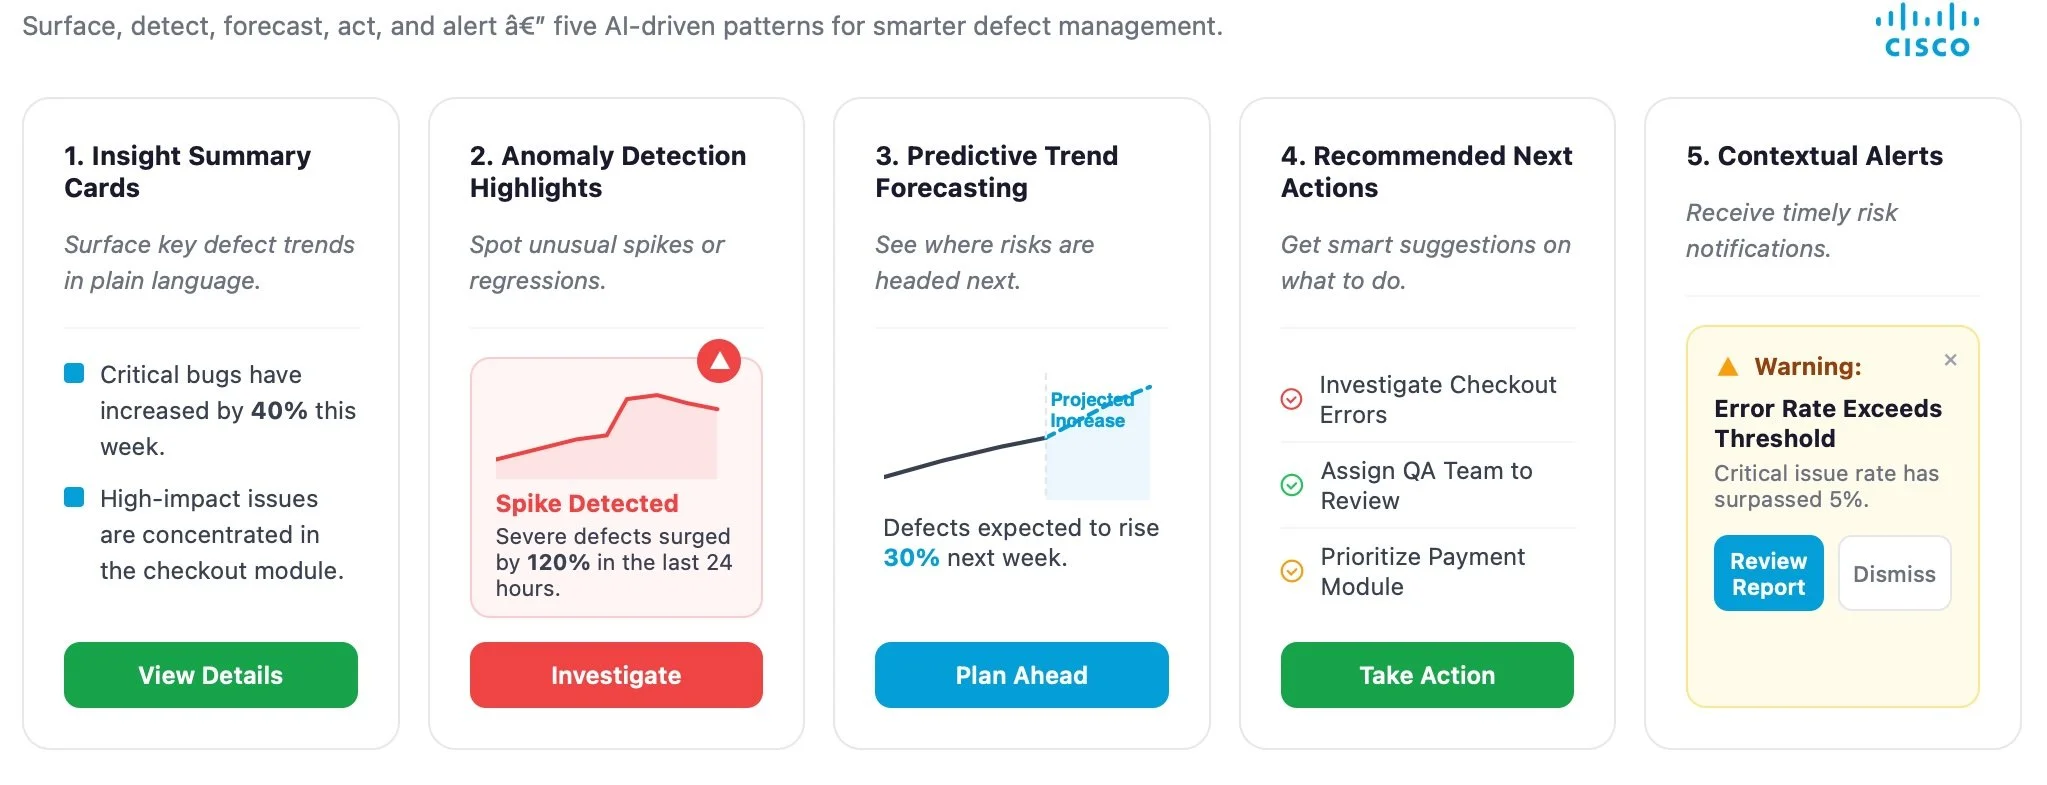
From Reporting to Decision-Making
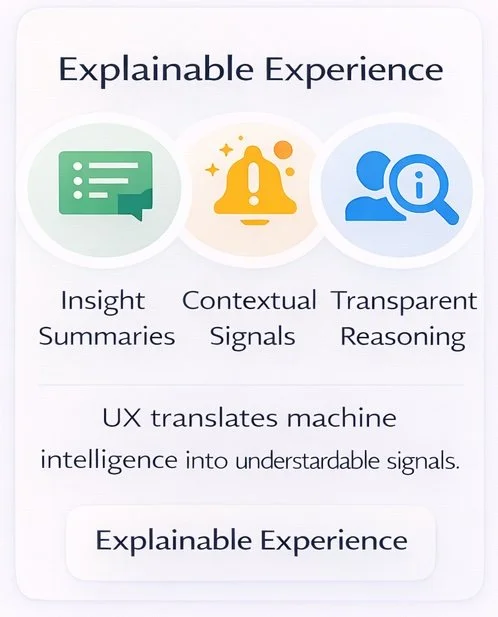
AI insights are only valuable when people understand and trust them. The experience emphasizes clarity, transparency, and actionable guidance so users can move from analysis to decisions without friction.
By surfacing explainable signals and contextual recommendations, the system helps teams prioritize issues, align faster, and take informed action.
AI Workflow: From Signal to Action
I designed the workflow to reduce manual interpretation and help teams move from data review to decision-making faster.
Detect → Summarize → Diagnose → Recommend → Act
The system continuously monitors defect data, identifies meaningful changes, translates them into structured insights, and guides teams toward prioritized actions.
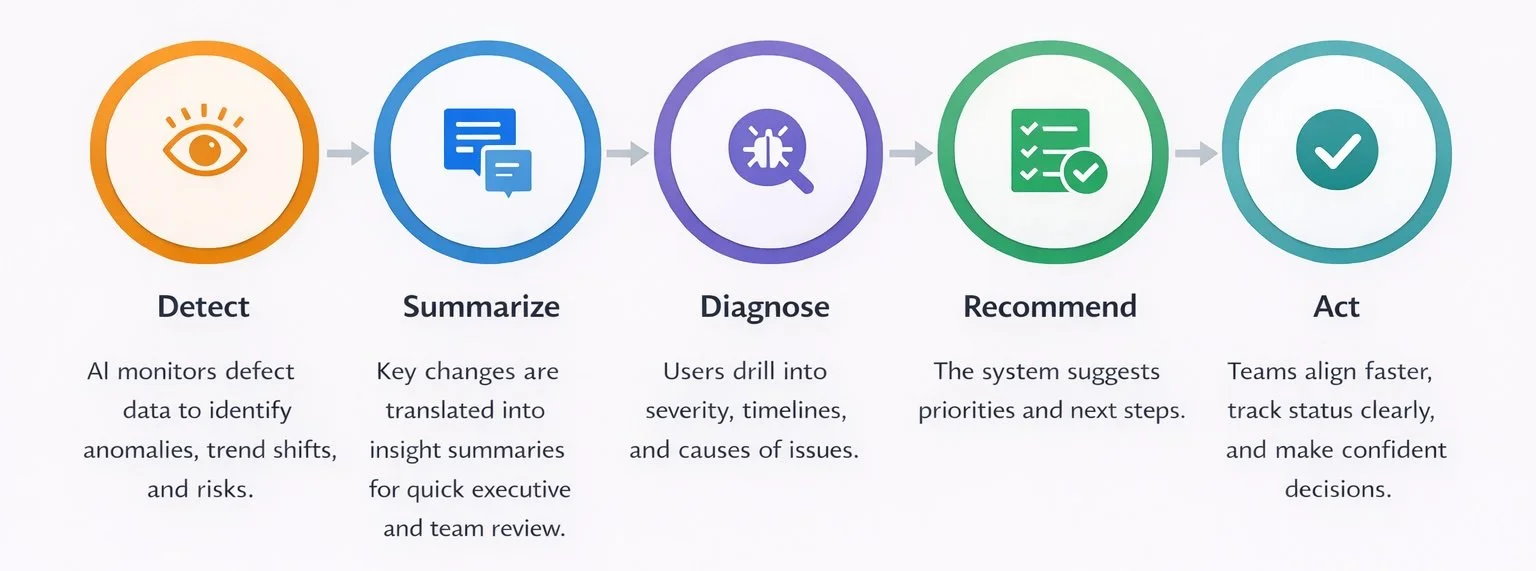
This framework is reflected in the product experience above, where AI transforms raw signals into insights, guides decisions, and enables teams to take action with confidence.
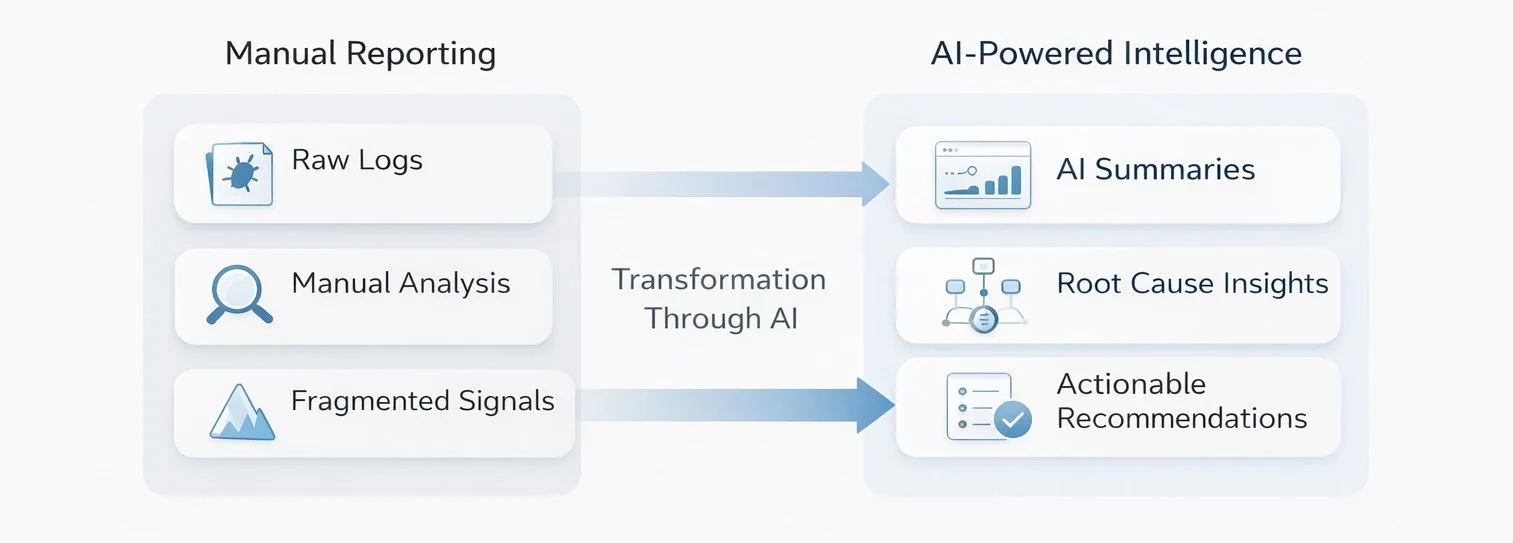
From Reporting → Intelligence
Shifted defect reporting from manual analysis to Ai-driven decision support
AI-Powered Defect Intelligence Dashboard
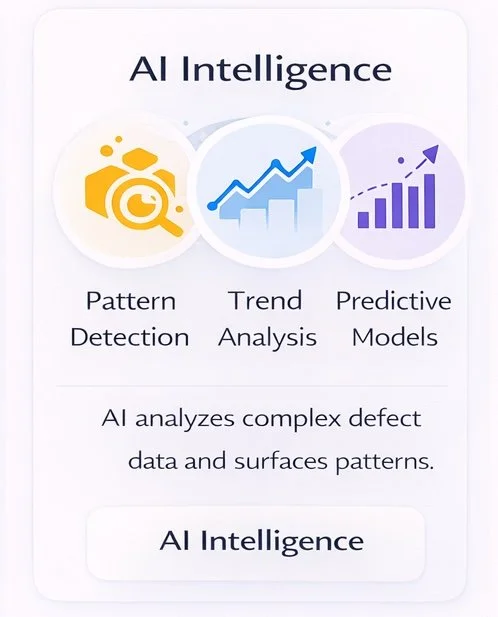
—> Understanding
• Automated Insight Summaries
• Usage Pattern Detection
Decision Support
• Real-Time Impact Analysis
• Predictive Recommendations
Proactive Monitoring
• Intelligent Alerts
• Risk Forecasting
The platform was designed with future intelligence capabilities
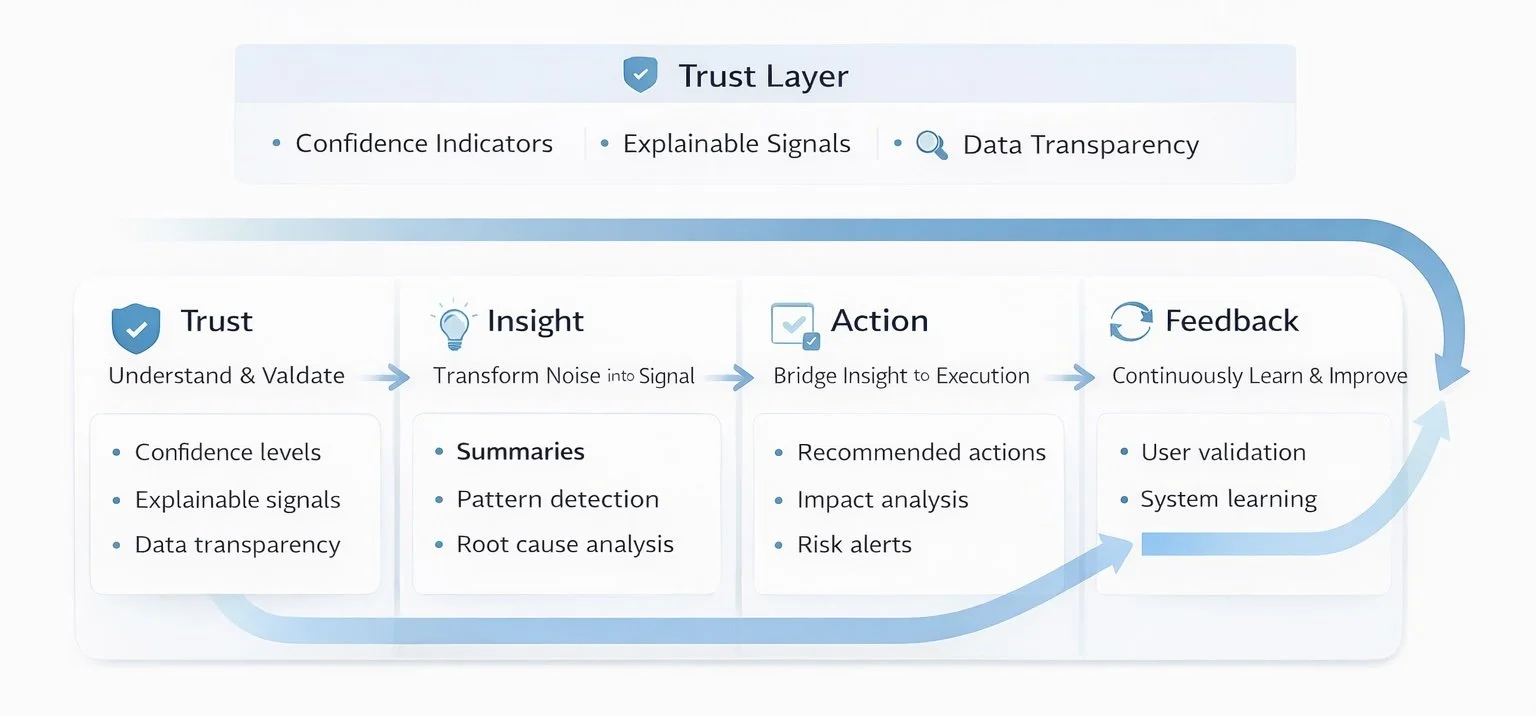
AI Design Principles for
Trust & Action
Trust
Make AI understandable and verifiable
→ Explain signals, show confidence, provide context
Insight
Turn fragmented data into clarity
→ Summaries, grouping, root cause hints
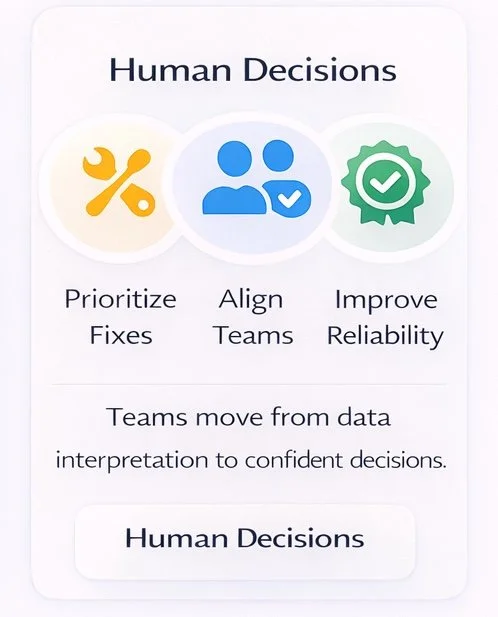
Action
Bridge insight to execution
→ Recommendations, prioritization, ownership
Feedback
Continuously improve the system
→ User validation, learning loop
Crafted an AI system that helps teams understand, prioritize, and act with confidence
Design System
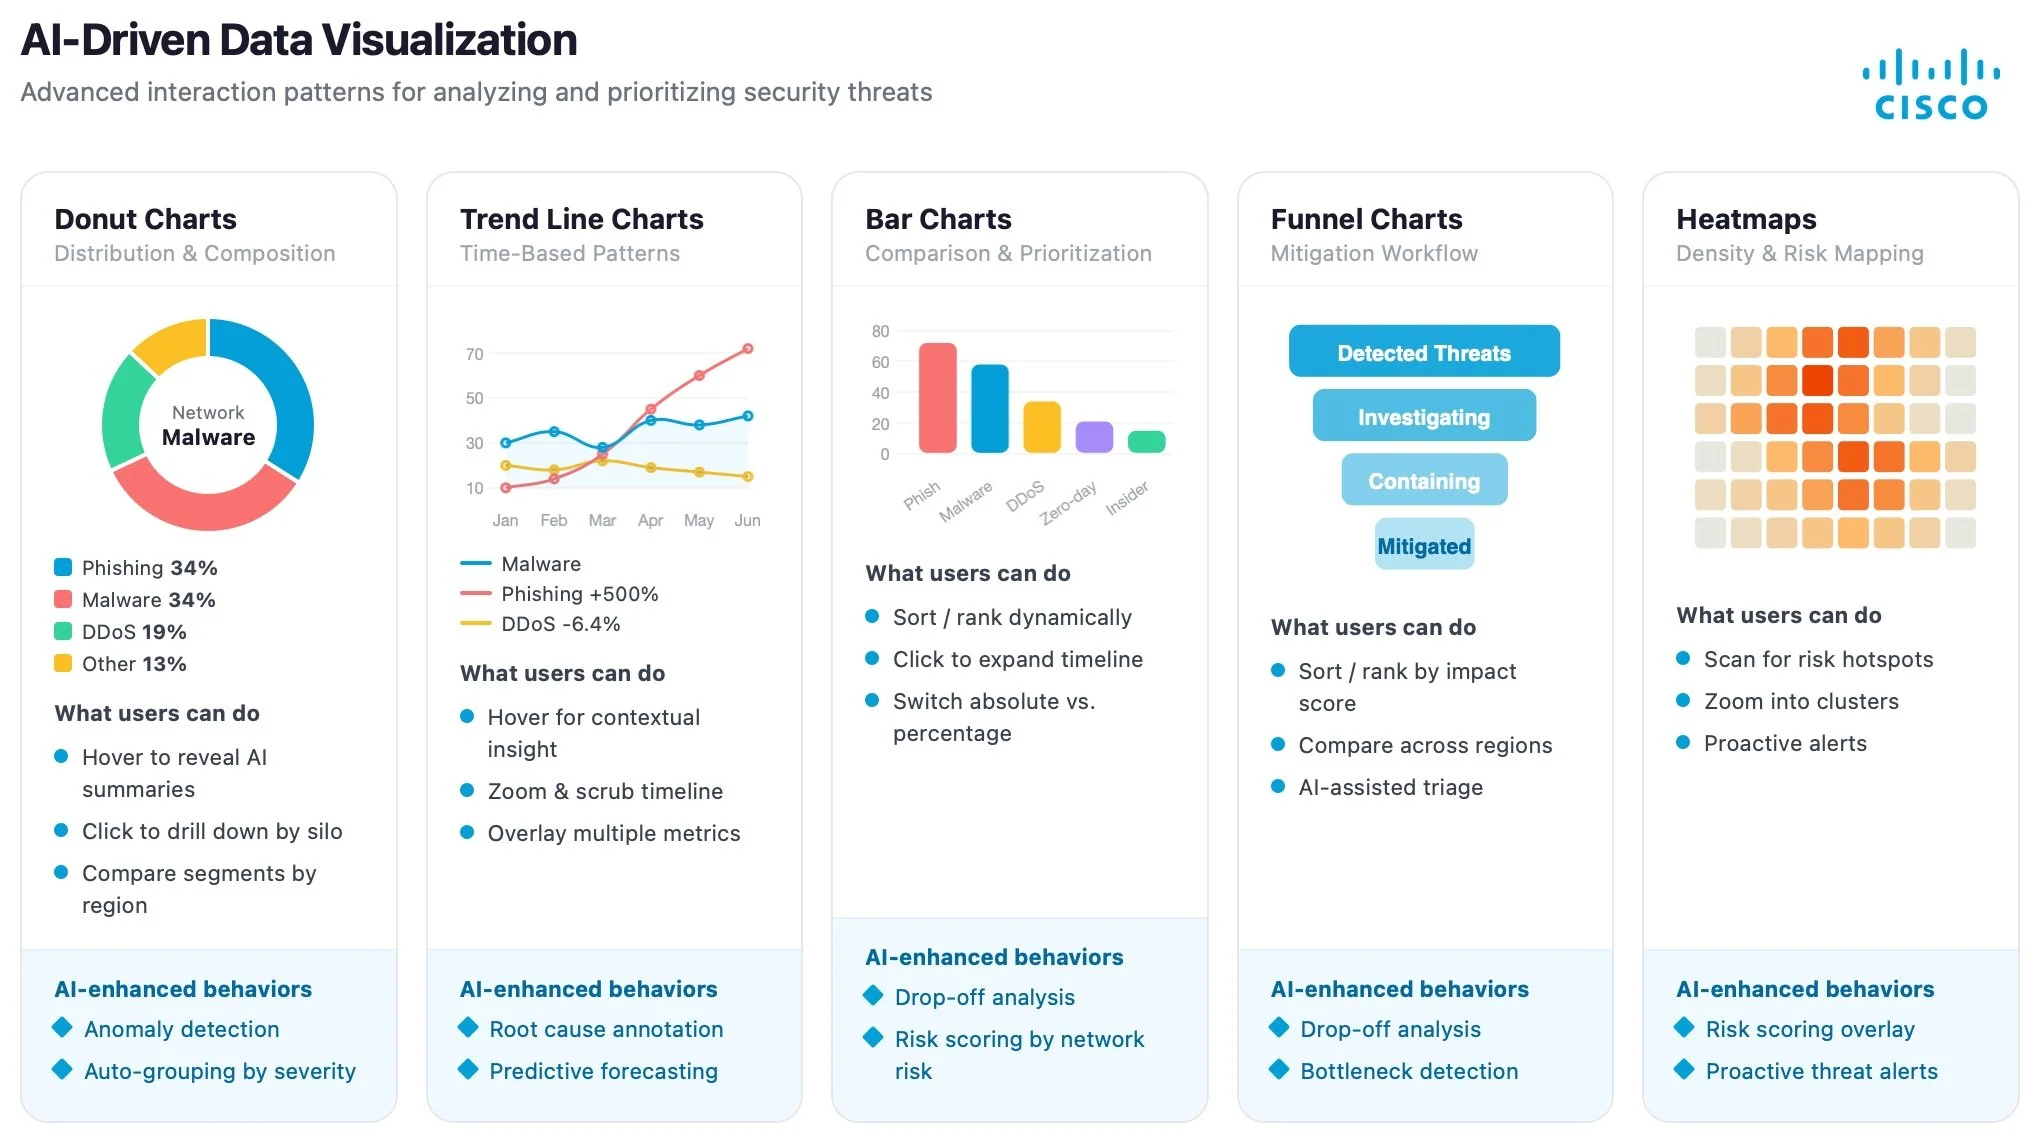
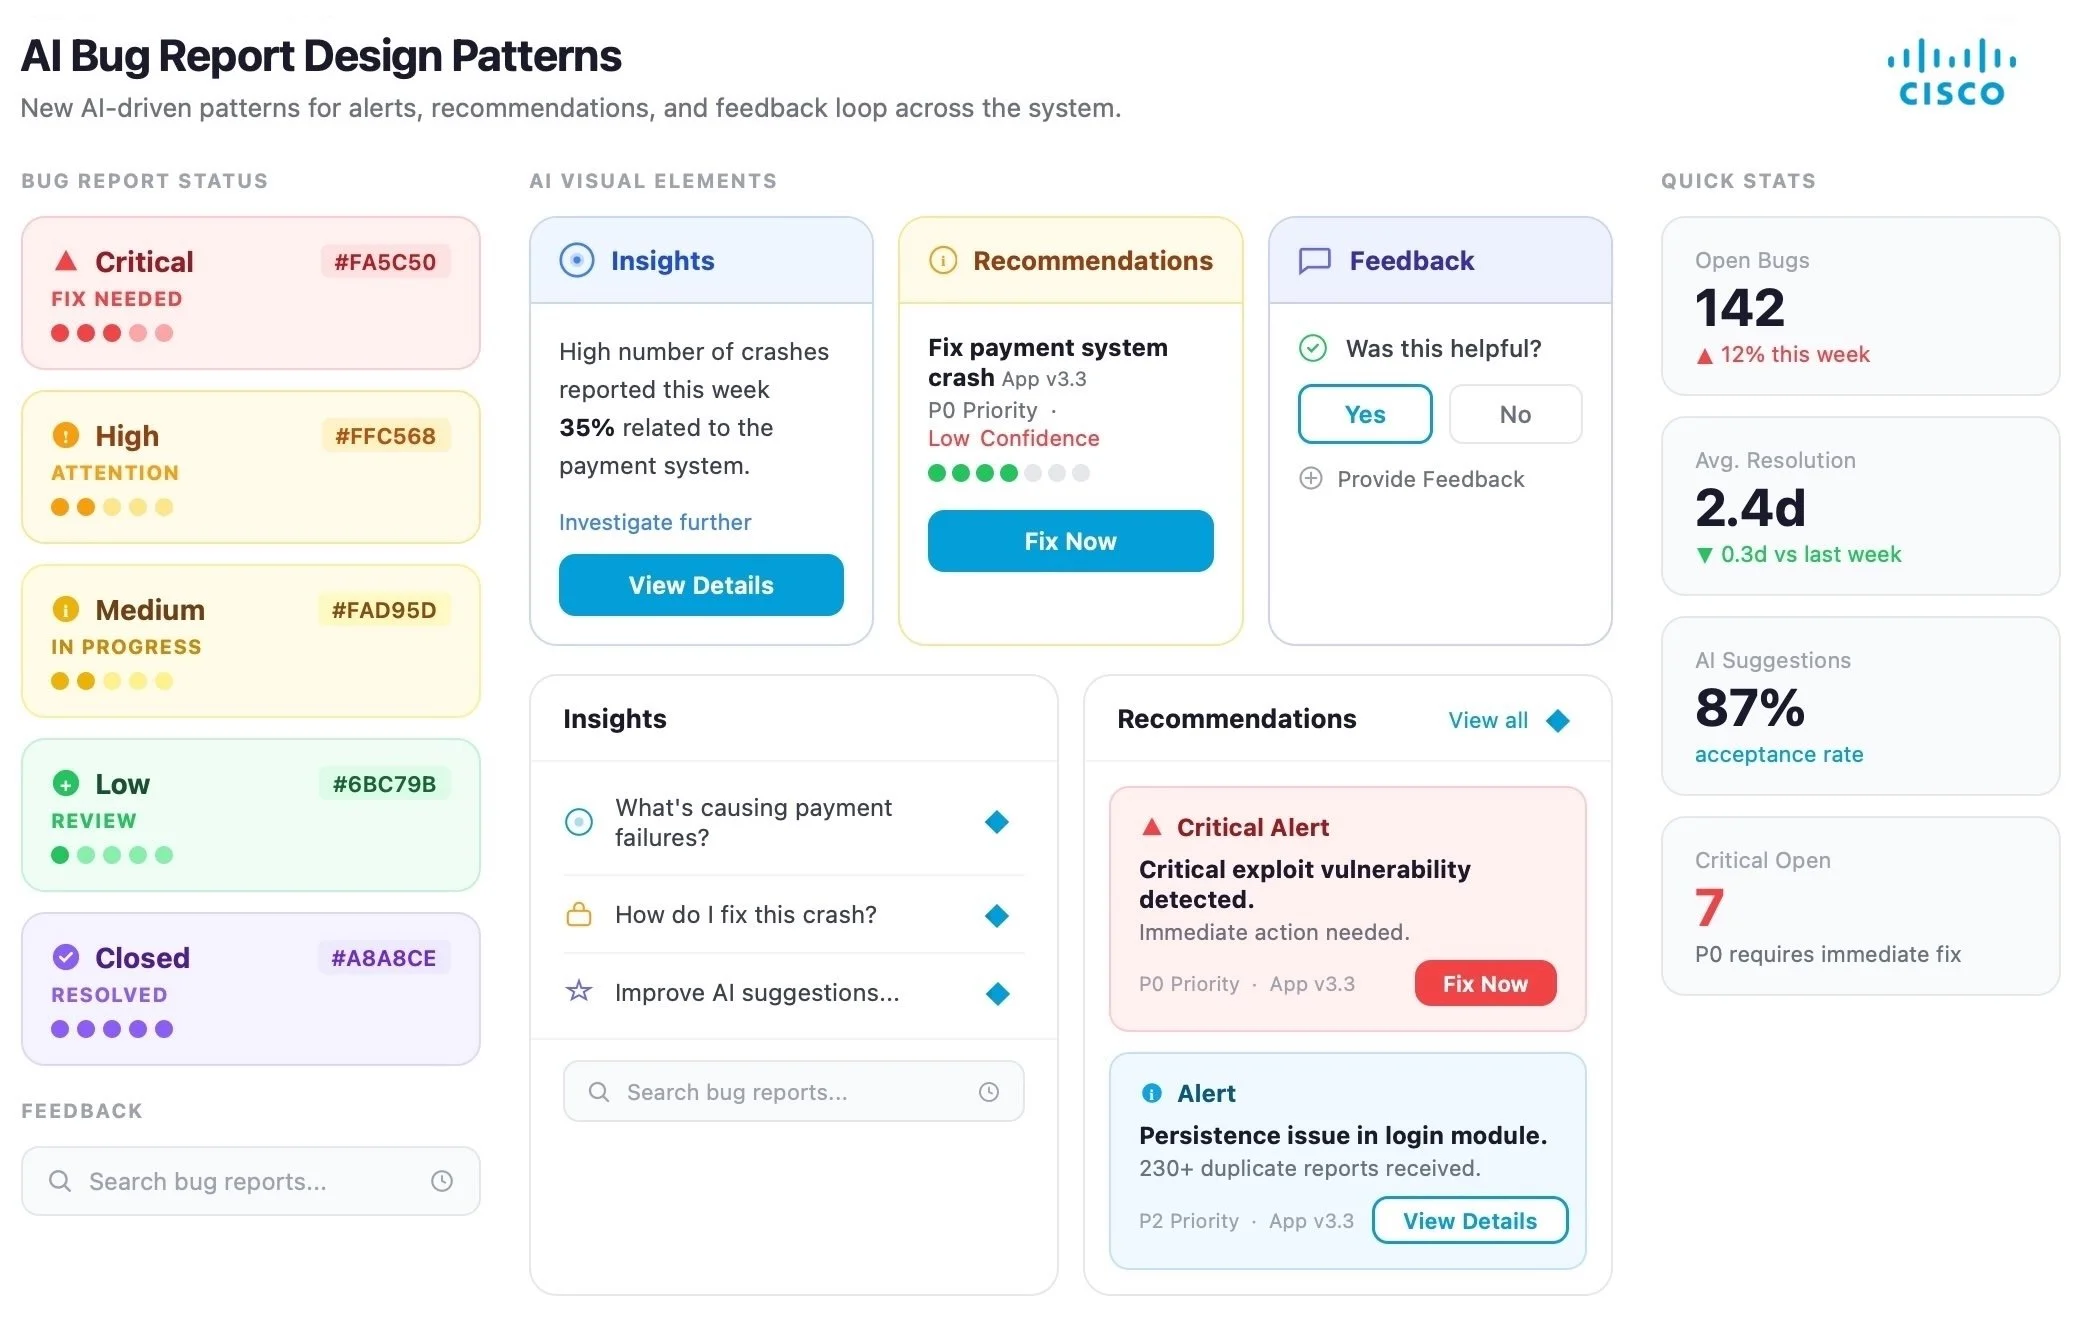
New AI Design Patterns
I introduced a set of AI-driven design patterns into the existing design system, standardizing how data visualization, insights, recommendations, feedback, and smart alerts are presented. These patterns translate complex data into clear signals and actionable guidance, ensuring consistency, scalability, and trust across the experience.
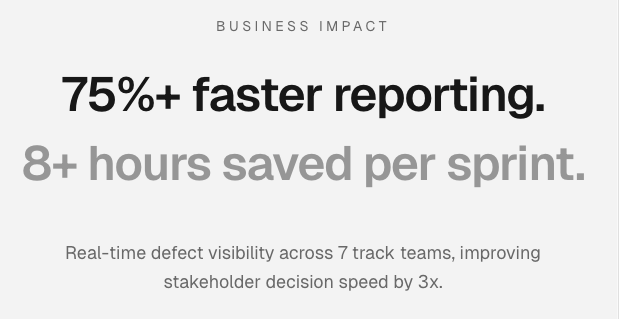
Outcome
The redesigned experience improved speed to insight and enabled teams to prioritize and act on defects more efficiently.
From Static Slides to a Scalable Digital Reporting System
• Replaced static PowerPoint reporting with a scalable digital dashboard solution
• Led end-to-end product vision, user journey mapping, and reporting framework
• Designed interactive dashboards to eliminate manual slide-based workflows
• Transformed complex reporting requirements into a live, functional system
• Accelerated stakeholder decision-making through improved data visibility